Recommendation for individuals using a screenreader: please set your punctuation settings to "most."
Recommendation for individuals using a screenreader: please set your punctuation settings to "most."
Descriptive Statements:
- Apply knowledge of the connection between phase change and energy transfer, including with heating curves and phase diagrams.
- Apply knowledge of energy flows of physical and chemical processes (i.e., endothermic and exothermic) and what they imply about the process.
- Apply knowledge of calorimetry as an experimental technique, including concepts of specific heat capacity, temperature change, and thermal equilibrium.
- Apply knowledge of temperature as a measure of average kinetic energy, including with Maxwell-Boltzmann distributions.
- Demonstrate knowledge of the varying energies of chemical bonds formed and broken during a chemical reaction using models (e.g., potential energy diagrams, enthalpy diagrams, Born-Haber cycle).
- Demonstrate knowledge of the energy released during nuclear fission, nuclear fusion, and radioactive decay.
Sample Item:
Use the graphs below to answer the question that follows.
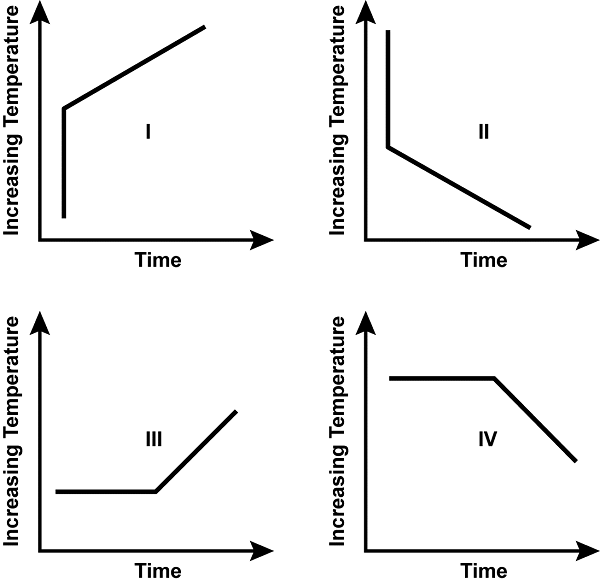
All four have x axes labeled time and y axes labeled increasing temperature. Graph 1 shows a vertically increasing line that then turns to continue increasing upward diagonally to the right. Graph 2 shows a vertically decreasing line that then turns to continue decreasing downward diagonally to the right. Graph 3 shows a horizontal line that turns to increase upward diagonally to the right. Graph 4 shows a horizontal line that turns to decrease downward diagonally to the right.
Which of the graphs could represent the temperature-time relationship for a pure substance undergoing a pair of sequential, endothermic, physical processes?
- graph I
- graph II
- graph III
- graph IV
Correct Response and Explanation (Show Correct ResponseHide Correct Response)
C. Endothermic processes are associated with a net absorption of heat energy. In physical processes, when there is no chemical change occurring, these typically take the form of either phase changes, which occur with no corresponding temperature increase, or an increase over time in a substance's temperature. Graph III is the only of the four provided options that models both of these typical types of endothermic processes: first a phase change, then a temperature change.
Descriptive Statements:
- Demonstrate knowledge of the laws of thermodynamics.
- Apply knowledge of enthalpy to the calculation of enthalpy change values (e.g., Hess's law, standard enthalpies of formation).
- Demonstrate knowledge of entropy changes in physical and chemical processes.
- Analyze chemical systems using the relationship between entropy, enthalpy, temperature, and Gibbs free energy, including predictions of spontaneity.
- Apply knowledge of the interconnections between Gibbs free energy and other measures of chemical systems (e.g., equilibrium constants, electrochemical cell potential).
Sample Item:
Which of the following sets of inequalities accurately represents the relative number of accessible microstates for liquid (W(l)) and gaseous (W(g)) particles, and the entropy change (Δ delta S) for the evaporation of liquid ethanol?
- W(l) < W(g), so Δ delta S < 0
- W(l) > W(g), so Δ delta S > 0
- W(l) < W(g), so Δ delta S > 0
- W(l) > W(g), so Δ delta S < 0
Correct Response and Explanation (Show Correct ResponseHide Correct Response)
C. Evaporation, a liquid-to-gas phase change, is associated with increasing inter-particle distance and decreasing inter-particle interaction. This increases the relative freedom of particles in a gas to occupy different positions, or microstates. An increase in the number of microstates is one of the definitions of a process associated with a positive entropy change.
